WE've harvested all data from thousands of company updates
Not by scraping, but using a real API connection
We love data and LinkedIn. So logically we combined that love into something really special.
Performance Reporting with real-time data!
Our love baby.
(not the purple baby)
Not by scraping, but using a real API connection
We had over 6.000 updates, but the engagement data of posts older than 12 months was not available through the API. So this report is based on updates posted between November 1st 2019 and November 31st 2020.
We will update this monthly with added data.
We learned a lot. We now know a lot of secrets about Company Page performance that were not known or published before.
Continue reading to find out all those secrets, because we love to share them with you.
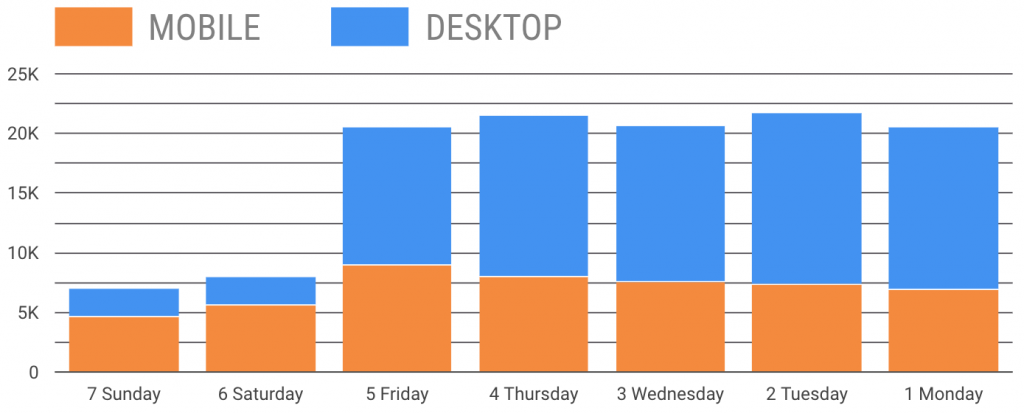
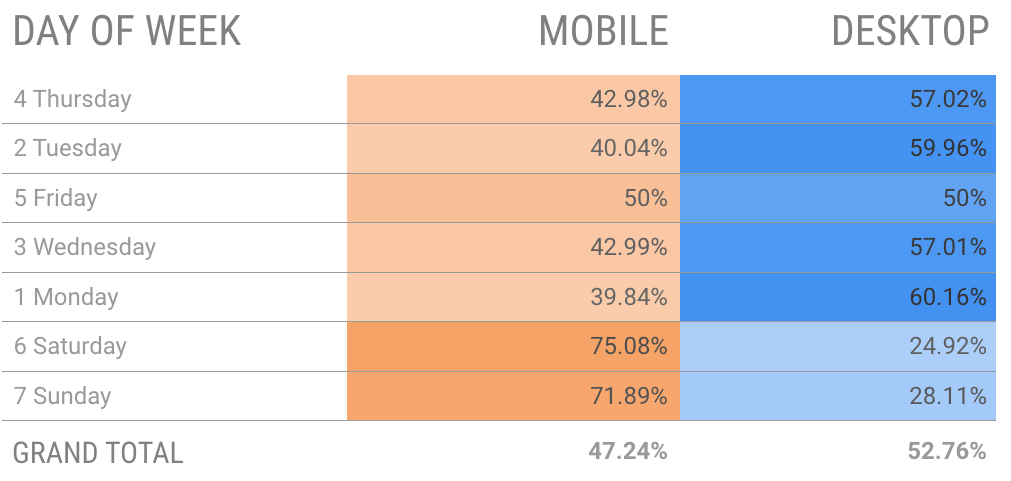
Company Pages are visited mostly on weekdays, using a desktop computer or laptop. Almost equally spread over the days.
In the weekends the number of visitors drops to 40%, but from that visitors, over 75% uses mobile.
Maybe not so surprising, but now it’s proven by data.
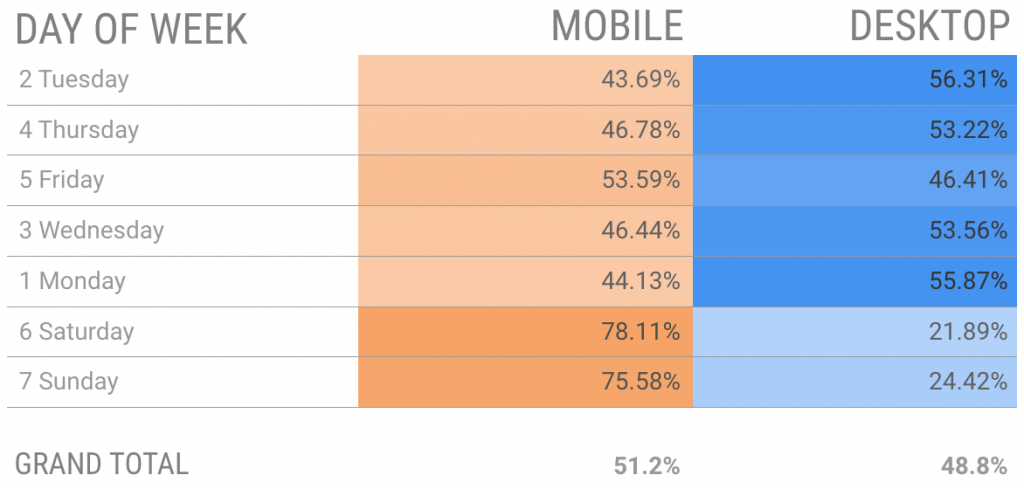
The overview page (where you can read the about section of the page) is mostly visited by desktop users.
It is important to completely fill out all fields for the Company Page.
Keep in mind that you can have multiple languages for the headline and about text, based on the language settings of the visitors!
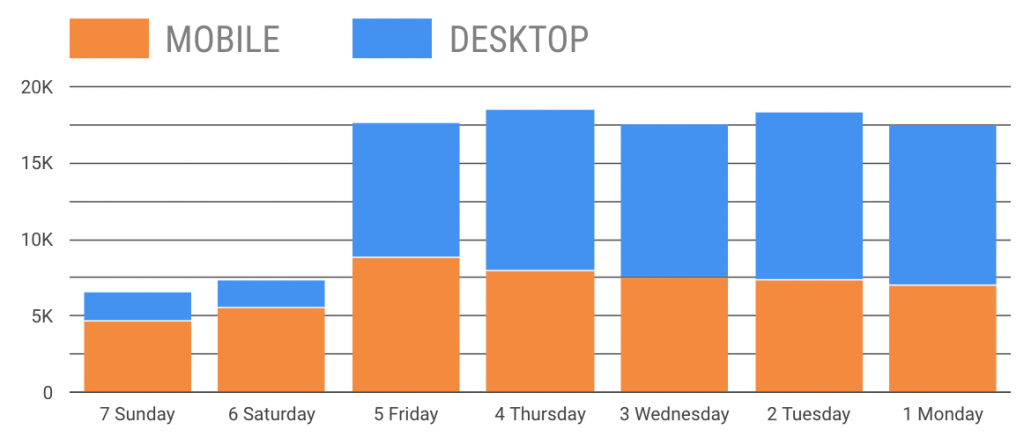
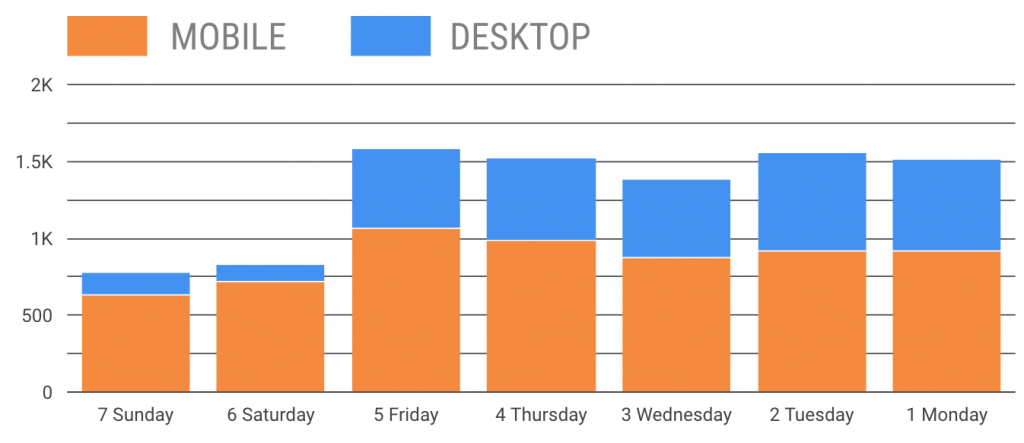
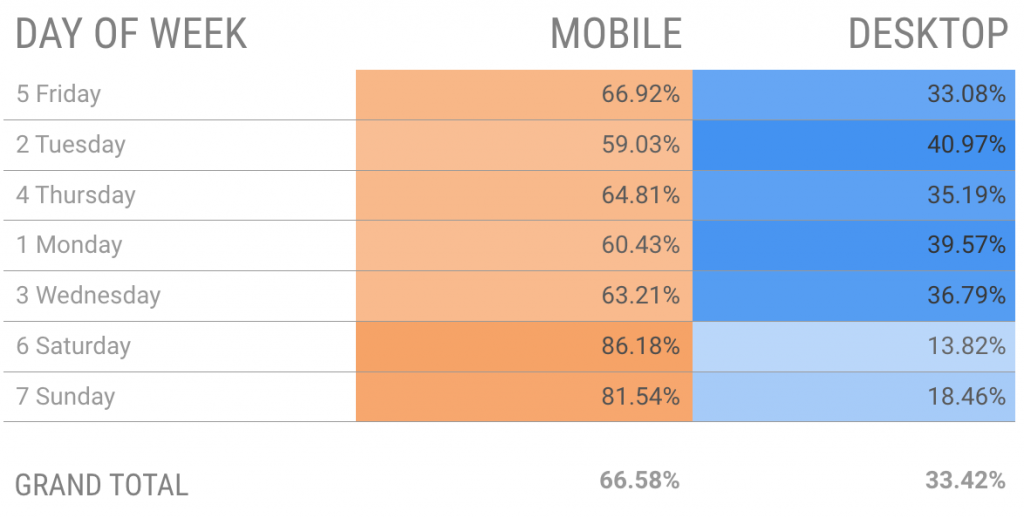
When you look at the visitor data for the Job Page, we noticed that the percentage of mobile users is higher than the normal page visitors.
One conclusion that we make out of this is that most people visit the job page after working hours.
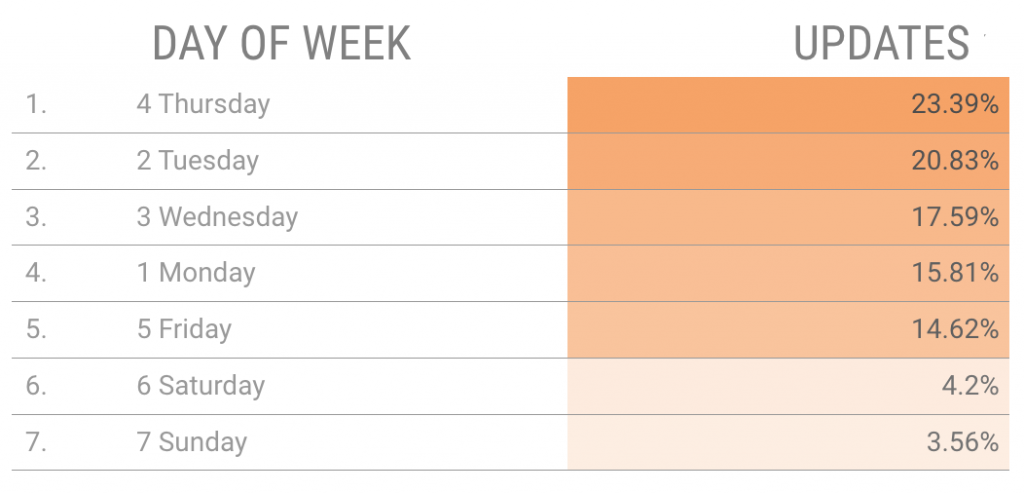
Overall we see that Thursday and Tuesday are the most favorite days to post an update.
Maybe because it’s scheduled that way.
The weekend is really lacking behind and that turns out to be a missed opportunity.

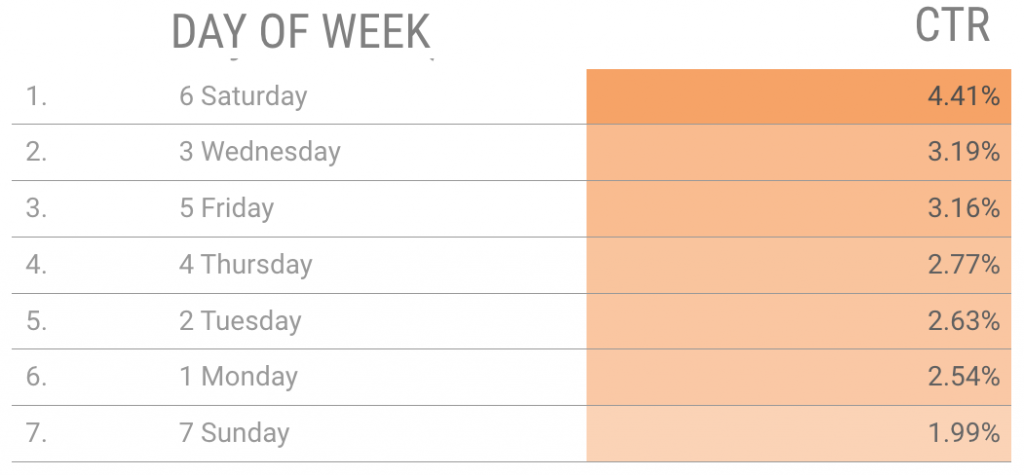
Suprisingly Friday, Saturday and Wednesday have the highest conversion rates. While most updates are posted on Tuesday and Thursday.
What we experienced ourselves is that posting an update in the weekends will have better results. First of all because there is not that much competing content and second, on the long term it will still get attention on Mondays.
CTR = Click Through Ratio. The percentage of people that see the post and click on the link.

Engagement is all about the interaction you get on an update.
We mean likes, comments and shares.
Company Page managers should inform the employees more about the updates, so they can engage with the content.
More engagement means more views.
When people connect their working experience to the right Company Page, they are automatically counted as followers.
Over time the total number of followers should grow organically by posting interesting updates and getting engagement.
What we see in our research results is that posting on a regular base, will also increase the number of followers.

Do you know the difference between native and non-native content on LinkedIn? Well, one thing you must know is that LinkedIn absolutely treats them differently.
The algorithm prefers Native content.
Native content at LinkedIn is all content that is placed directly on LinkedIn.
Images, video, tekst, uploaded documents, polls.
LinkedIn generally gives native content more exposure in the timeline.
So native content is preferred over non-native content.
That means that a Native update gets 222% more impressions than a non-native update!
As we keep gathering more data, we will update these results on a monthly bases.
So bookmark this page for future reference or follow us on LinkedIn.
As content distribution is becoming more important for your business, you want to know how well you are performing.
You want to know if you reach the right audience, what posts are most successful and how you perform compared to our benchmarks.
We offer Company Page Performance reporting for all Companies. We will deep dive into your data of the past 12 months. We analyse it, compare it with our benchmarks and will give you a custom advice on how to improve.
You can have a look at a demo report here!
You can go for a one-time report, and after that you can get a subscription for monthly or quarterly reports.
The LinkedIn Corporation is the proprietor of the word and figurative marks LINKEDIN. Next Business Academy B.V. is an independent company that is in no way affiliated with LinkedIn. Where the LinkedIn brands are used on this website, this is purely intended to refer to LinkedIn, and not to suggest that Next Business Academy B.V. is directly or indirectly commercially linked, nor is there an agreement between Next Business Academy B.V. and LinkedIn.
Next Business Academy B.V.
Hurksestraat 19 – 4.79
5652 AH Eindhoven
The Netherlands
0031-(0)6-27066822